Videos
Security How To Videos
-
XYGATE Merged Audit (XMA) & XYGATE Transaction Router (XTR)
In this video we will walk you through the installation process for XYGATE Merged Audit (XMA) and XYGATE Transaction Router (XTR) using the IWIZARD auto install script. As a part of the Security Bundle from HPE, everything you need is already on your NonStop Server. -
XYGATE Access Control (XAC) - Keystroke Logging
This video is XYGATE Access Control (XAC) – Keystroke Logging. The objective of this video is to show how XAC can be configured to provide full and partial keystroke auditing. -
XYGATE Merged Audit (XMA) Manager - Pathway Management Menu
This video will focus on the Pathway management menu. This menu will help you check the status of your XMA installation, and start and stop the Pathway. -
Locating and Installing the XYGATE GUI Clients
This short introduction to the XYGATE software standard Windows GUI clients will give you a little background information about the how to find the installation software, downloading the software from the XYGATE installation subvolume, and executing the Windows installation programs. -
Installing XYGATE user Authentication (XUA) & XYGATE Transaction Router (XTR)
In this video we will walk you through the installation process for XYGATE user Authentication (XUA) and XYGATE Transaction Router (XTR) using the IWIZARD auto install script. As a part of the Security Bundle from HPE, everything you need is already on your NonStop Server. -
5 Best Practices for HPE NonStop File Integrity Monitoring
File Integrity Monitoring (FIM) is a foundational requirement for security compliance frameworks to help identify unexpected or malicious activity across critical system files, diagnose unwanted or inadvertent changes, and shut down attacks before they have a chance to cause damage and disruption.
Organizations that collect and process credit card transactions and payments data must comply with the Payment Card Industry Data Security Standard (PCI DSS) requirements 10.5.5 and 11.5 that state organizations must make efforts to monitor file modifications and ensure the integrity of critical logs from within their Cardholder Data Environment (CDE).
On HPE NonStop servers, XYGATE SecurityOne (XS1) monitors and alerts when key files, objects, or system configurations are viewed, deleted, modified or ownership has changed. XS1 identifies who made the change and if the change put the system at risk or violated policy.
This intelligent form of real-time integrity monitoring simplifies monitoring activity and helps meet the strictest of compliance requirements while reducing noise generated by unnecessary alerts. Your resources are focused on the most critical security events.
Join XYPRO Technology’s Chief Product Officer & CISO, Steve Tcherchian, and Solutions Delivery Specialist, William Ferrara, as we demonstrate the Top 5 HPE NonStop File Integrity Monitoring use Cases. -
NonStop Education Day - HPE NonStop Security with XYPRO XUA and XMA
In this training session, you will learn how to install and configure XYGATE User Authentication (XUA) and XYGATE Merged Audit (XMA), both of which are already included with every HPE NonStop server, to properly secure and optimize your NonStop systems and applications from a catastrophic security breach and ensure compliance with all the current global regulations.
We will show you how to configure User Authentication to restrict access by users, groups, ip address port and more. We’ll then discuss integrations such as Microsoft Active Directory for Single Sign-On to integrate your NonStop servers with the rest of your enterprise and RSA SecurID for Multi-Factor Authentication to address the latest PCI-DSS requirements.
The second half of this session will focus on how to configure collectors to gather data from various NonStop security sources using Merged Audit. We’ll also describe security oriented best practices around data filtering and database management concepts. You will learn how to integrate your collected data into analytics tools like SPLUNK, IBM QRADAR and RSA Netwitness. We’ll demonstrate how to create useful security dashboards, reports, and alerts.
The program will wrap with a discussion around troubleshooting XUA and XMA if things go wrong to ensure you can recover quickly. -
Proactive Risk Management HDFC, India’s Largest Private Bank, modernizes CyberSecurity
Join Shailesh Khochare, Senior Vice President, Head Data Processing Centre, IT Security Operations & Compliance for HDFC as he discusses HDFC’s use of XYGATE SecurityOne (XS1), the “single pane of glass” solution to contextualize, prioritize and control HPE NonStop and ACI Base24 security incidents. -
KeyStroke Logging for HPE NonStop Servers
Privileged accounts hold the keys to the most critical data on your HPE NonStop servers. They can take action with the highest privileges on the most sensitive areas of your system. PCI DSS requires that all actions taken by any user with administrative privileges must be tracked.
Presented by XYPRO Senior Solutions Architect and Connect User Group Past President, Rob Lesan. This webinar will cover it all!
If your HPE NonStop servers handle PCI data, you need to keystroke log privileged users! Period. You must implement automated audit trails for all system components in order to reconstruct the following events:
All individual user access to cardholder data.
All actions taken by any individual with root or administrative privileges.
Keystroke logging is the most effective method to meet this requirement.
XYGATE captures keystrokes from Guardian (TACL), OSS (ksh, bash, etc.), via telnet (hopefully over TLS!), ssh or any other method. XYGATE keystroke logging operates with or without Safeguard and differentiates between a user and an alias for both reporting and control.
Keystroke logs combined with a SIEM or Security Intelligence technology, go beyond compliance to real-time detection and prevention of data breaches.
Compliance requirements, zero overhead, extensible reporting and the ability to record actions from all users via XYGATE is the ideal solution to meet this very necessary security requirement.
Database How To Videos
-
Merlon Discover Categorizing your Database using Worksheets
Worksheets were added to Discover to provide users with a signoff capability, allowing them to manually review and intervene rather than having Discover simply performing automated maintenance. These consist of three parts; filters, dispositions, and worksheets.
Learn more about Discover
https://www.xypro.com/merlon/
Worksheets were added to Discover to provide users with a signoff capability, allowing them to manually review and intervene rather than having Discover simply performing automated maintenance. These consist of three parts; filters, dispositions, and worksheets. You can see here a worksheet, called AUDITOFF, that identifies files whose TMF AUDIT flag has been turned off since the last scan. The default disposition, or what Discover does to the files, is to turn the audit flag back on and to run a TMF DUMP on the file. The problem is that the audit flag may be turned off as part of normal maintenance, so we don’t want Discover to just reset the flag in all cases.
Every time Discover runs it’s nightly scan, an entry for each file matching the filter will be added to the worksheet and they will appear with a state of NEW. Nothing else will be done until we choose the steps to take. We can choose to NOTE a file, indicating that we know about the situation and do not want Discover to take any action. Noted files will stay on the worksheet until deleted. We can also choose to delete files for which we don’t want to take any action. For the most part, though, we will select something to be done with the file by DISPOSing it. We can choose to use the default disposition configured to the worksheet, or choose another disposition. In this case, AUDITON will restore the audit flag without generating a TMF dump. So we now have one file noted, one file deleted, and one file signed off to request that Discover perform the disposition.
Still, nothing will happen until the worksheet is executed, so we’ll press the execute button here. {wait 10 seconds} Pressing refresh, we see that the noted file is still here, the deleted file has been dropped from the worksheet, and the file we chose to fix has been marked as done. Discover has turned audit back on on that file.
One common, and unexpected, use that our customers have found for worksheets is that of adhoc report generation.
So, the filter is similar to a Discover condition in that it is a true or false statement identifying a file or disk volume that needs to be flagged, requiring some action on the part of the user.
For this example, we will be looking for saveabend files that have been created during the last week. We will give our filter a name, THISWEEKSSAVEABENDS, then start the criteria editor to enter the attributes of the files we are interested in. Filter and condition criteria are entered as strings, and you can press the choose button any time you wish to select the next part of the text.
The first item we need to look at here is CREATIONTIME, allowing identification of files that have been created for a given timeframe. This can be entered as an absolute date and time, or a relative number of hours and minutes, so here we enter greater than -168:00 hours, or one week. Since we need a little more information to identify our files, we enter AND to show that both parts of our filter must be true and add an attribute to identify saveabend files. We could do this by entering the file name as NAME = “$*.*.ZZSA*”, or by choosing the well known FILECODE = 130.
We will now create a worksheet with some special settings. First, we’ll select the filter we created and choose to automatically signoff new entries, indicating the default disposition will be applied to all files when the worksheet is executed.
Then we select the disposition NULL which was previously created to do nothing to the file it is assigned to.
The worksheet will be run automatically every day at ten am.
So now, we’ve created our worksheet, so every time the Discover runs its scan, the worksheet will be populated with the files that we are interested in. We’ve previously created another copy of the same worksheet, so let’s look at its contents. You can see the saveabend files that we’re interested in, each with a SIGNED OFF state and NULL disposition. Executing the worksheet, which happens automatically every day, will mark the signed off files as done and delete the entries for any files that are marked done.
You now have a daily report of saveabends that have been generated in the last week and can use Copy in the Edit menu to move the list to a tab-separated spreadsheet. -
Merlon SQLXPress Finding and Tuning a Poorly Performing Query
SQLXPress stores query execution plan information in its own database rather than regenerating plans dynamically for every function, which allows users to perform a number of useful tasks when optimizing query execution. This video shows how to use SQLXPress to quickly analyze, tune and optimize NonStop SQL queries.
Learn more about SQLXPress
https://www.xypro.com/merlon/
SQLXPress stores execution plan information in its own database rather than regenerating plans dynamically for every function, which allows us to perform a number of useful tasks when optimizing query execution. Select Work with Execution Plans to access this database.
The first thing we can do to is to report on execution plans that display particular attributes of queries that we are interested in. Select Query Execution Plans to generate these reports. The first page limits the objects we are looking for, in this case select standalone queries, which are queries that have been manually entered or scanned from EMS tracing of ODBC and JDBC activity.
The second page specifies the attributes we are looking for. There are several properties to choose from, but for our example we will look for queries with high statement cost.
Press Continue to go to the next step and execute the query. From the list of entries, we can select a query of interest and display the execution plan for our review.
SQLXPress makes the plan more readable by displaying it as a tree. Each plan fragment is colour-coded, displaying the type of operator, the percentage of the plan spent within that operator and, where appropriate, the name of the object to which the operator applies. Above each node is the number of rows expected to be returned from that node. The plan percentage is also displayed as a red bar to the right of the node to highlight points of high percentage. In this case, we can see that 73% of the plan is spent on a file scan of X21DET. Also, hovering over a node will display the details of that node.
Select the Details tab for a text view of the plan, which can be navigated by selecting nodes in the tree to the right.
Select the Summary tab for a grid display of the plan operators as well as the most important attributes of those operators.
The SQL Statement tab displays the text of the statement for the execution plan.
A more comprehensive way to find poorly performing queries is via the Query Advisor. Select Use the Query Advisor from the SQL/MX Execution Plans page. Similarly to the Query Execution Plans page, you can choose to work with programs for static SQL, SQLXPress queries, or MFC locations for this analysis.
Press Continue to choose which queries we are interested in and enter _QR* to select the same query we had found.
Press Continue to select the advice thresholds. These are “rules of thumb” used to generate recommendations. For instance, the default of 60 days indicates that statistics that have not been updated in the past 60 days will trigger a request to update those statistics. Press Fetch Queries to extract the query we are interested in, then Generate to run the Query Advisor.
Click Continue to view the analysis results. This will recommend environment changes to improve the query’s performance, such as adding indexes or updating statistics. The advisor will also suggest syntax changes, such as optimization of LIKE predicates using substrings, that may improve the performance of the query.
The next step is to tune our problem query by selecting Use the Query Tuner from the SQL/MX Execution Plans page. The Query Tuner is a prototyping tool that allows us to perform in depth analysis of the effects of changing the actual query rather than adding statistics or indexes.
First, we open the query we are interested in, or create a new query by entering text in the Query Text panel. Queries are stored in multiple snapshots, each of which represents one execution plan generated. This allows us to easily compare the effects of changes made to our query.
The Execution Plan tab displays the execution plan in the same way as we saw in the SQLXPress client.
The Execution Statistics tab displays how the query performs in terms that are more easily discussed than query cost. This tab shows the compile and execution time of the query by pressing the Run Query button, which executes the query but does not return results to the client. You can run the query multiple times to avoid “cache bias”, which results in uneven response times based on the data retrieved from the cache, rather than from disk files.
Lastly, the Performance charts tab lists the query’s performance between snapshots. In this case, we can see that using Control Query Defaults to use nested joins only reduced the execution time by a factor of ten. -
Merlon SQLXPress Query Builder
SQL syntax can be complex, so SQLXPress includes a visual query builder to help in creating new queries.
Learn more about SQLXPress
https://www.xypro.com/merlon/
SQL syntax can be complex, so SQLXPress includes a visual query builder to help in creating new queries. Select Build a Query from the SQL/MX menu.
Press the Add Table button to add a table or view to the query. For each table, press the Add button to include that table in the query. Once you’ve added the tables you want, select Auto join to set the initial join conditions between tables and close the Add Table form. Auto join matches key columns in each table with columns of the same name and type in other tables.
To modify or delete a join, select the line joining the tables, then make any desired changes in the Joins tab, or press the delete button to remove the join. To add new joins, just drag a column from one table to another.
Beside the Builder Tab, you will see an SQL Tab, which displays the SQL text of the query. You can change the text her and it will be reflected in the Query builder tab, so I can specify an individual column, then switch back to the Query builder tab to see the reflected change.
Detailed changes can be made using the tabs at the bottom of the query builder. For instance, select the Where tab to filter this query, then press the plus sign to add criteria. To the right of the criteria expression is a helper button that will open an expression builder form. Here we can choose columns or functions, in this case we will just choose to display the orders for a single customer.
We can now select the Parameters tab to provide a default value and description of the parameter selected and we can now save and execute the query.
On the top left corner of the Query Builder is the Query menu, which allows us to save this query in the SQLXPress database. Press Save and save this query to a unique name. It is now stored on the server and may be used to retrieve data through the SQLXPress client or the XPressView client.
Press the Run button to execute the query, which will open the SQLXPress data browser with the query results. Each time the query is opened, you will be prompted for the parameter values. -
Merlon SQLXPress Building a Database
Although SQLXPress does include wizards to help create database objects, most databases grow from existing ones. There are several features of SQLXPress that will assist in this process, but the most commonly used one is the Show DDL wizard.
Learn more about SQLXPress
https://www.xypro.com/merlon/
Although SQLXPress does include wizards to help create database objects, most databases grow from existing ones. One example is creating a QA environment from a production database.
There are several features of SQLXPress that will assist in this process, but the most commonly used one is the Show DDL wizard. From the SQLXPress menu, select Manage the database, then Show DDL.
The first page of the wizard allows you to select the object you are interested in. You can select multiple items by wild card by checking Enable Wildcards. This is explicit because SQL/MX names can include the percent and underscore wildcards used in SQL, particularly underscores. If Enable Wildcards is not checked, SQLXPress will select the individual name that matches the pattern entered.
Press Add to add items to the list, then remove any you don’t wish to keep.
Press Continue to go to the next step. This step defines the ancillary objects to include and how the DDL statements will be formatted. For instance, check Include Location to preserve the disks on which partitions will be placed, then choose whether the system names or full file names will be included. Please note that choosing to retain these names will not allow you to create objects on the same system.
Press Continue to go to the next step. This page allows you to make large-scale alterations to the DDL script that will be created. You can create objects on a different schema, scale their sizes, and specify new locations here.
Press Continue to go to the next step, then enter the mapping between the selected and target schemas.
Press Continue to go to the next step, then choose the scaling factor. This is especially useful when creating copies of large environments, such as production databases, to smaller test environments.
Press Continue to go to the next step, then enter the disk volumes to be used for object locations.
Press Continue to go to the next step. The last page allows you to generate the script, either as MXCI commands, or SQLXPress’ MSCRIPT input. Press the Execute button to create the SQL objects as entered, or save the script to a text file to be altered and executed later. -
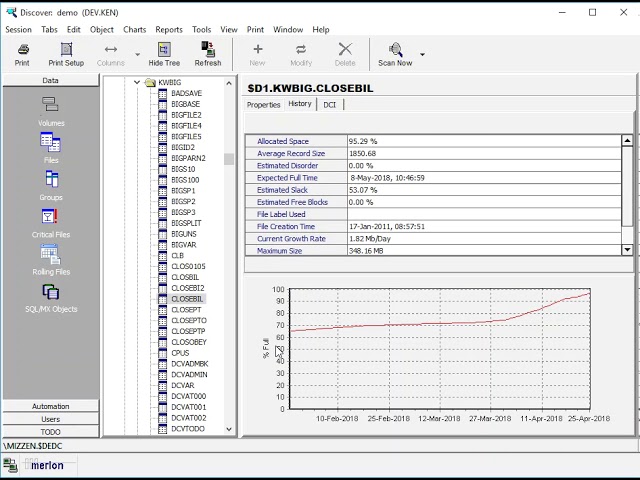
Merlon Discover Automated File Error and Growth Monitoring
Discover scans your database every day to find and predict issues with files and disk volumes, performing automated maintenance or letting you know that something needs to be done.
Learn more about Discover
https://www.xypro.com/merlon/
Discover scans your database every day to find and predict issues with files and disk volumes, performing automated maintenance or letting you know that something needs to be done.
Identifying issues is done using conditions, for which there is a large list of predefined conditions that are commonly looked for, as well as user defined conditions that may be a combination of predefined conditions as well as attributes of a file or disk volume. In this case, we will be looking at file full conditions. These appear in the conditions list as FILEFULLn, where n is a number between one and four. These numbers identify projection intervals, over which Discover estimates growth, and may appear for file full, disk full, or allocation error projections.
Looking at the Monitor attributes, we see that the projection intervals are set from lowest to highest, or most to least critical. In this case, the intervals are set to the default 1, 7, 30, and 90 days. This means that the FILEFULL1 condition will be triggered if Discover estimates that the file will be full within one day and FILEFULL4 for files that may be full in the next three months.
In this case, FILEFULL1 generates a critical message to EMS and sends an email message indicating the problem to the appropriate person.
First, we can look the file full report, which lists the files that will be full within one of the projection intervals and see our sample file, $D1.KWBIG.CLOSEBIL. Navigating to this in the Files tree, we can see that file’s growth in chart format. We can now start the Discover scan, which normally runs automatically once a day, to see how this file will be handled.
Our sample file will be full within about a week’s time, so we are interested in the FILEFULL2 condition. This performs up to three actions; an EMS message is generated using ALERT to the main console and the maximum size of the file is extended sufficiently to accommodate another week of growth. If Discover could not increase the file’s MAXEXTENTS, either because of an error or because the maximum has been reached, the IFFAIL token indicates that an email message will be sent to the appropriate person indicating that Discover’s palliative action has failed.
So, we now move to the TODO list, where we can see that the file has been extended. -
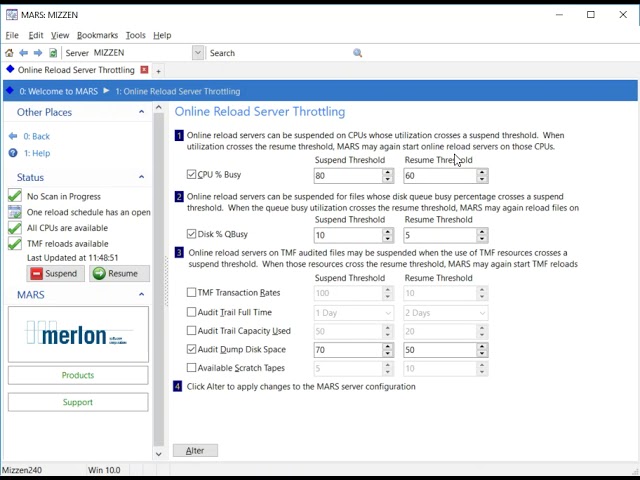
Merlon MARS Reload Load Balancing and Throttles
Beyond segregating reloads to particular times and splitting reloads between those times, MARS also provides several ways to balance and minimize the impact of reloads on your system.
Learn more about MARS
https://www.xypro.com/merlon/
Beyond segregating reloads to particular times and splitting reloads between those times, MARS also provides several ways to balance and minimize the impact of reloads on your system.
Select Configure Online Reload Server Load Balancing to ensure that reloads do not consume too much of any one resource on your system.
In this case, MARS can only start up to five reloads at any one time, even if more than one reload schedule has an open window and the total for all the open reload schedules is greater than five.
Similarly, you can limit the number of reloads running at the same time on any one CPU and for files residing on a particular disc. The last option should be noted carefully. Reloads on TMF-protected files do not generate a high transaction rate, but do store substantial data on the TMF audit trail, so limiting the number of reloads running on files allocated to a single audit trail is important.
Select Configure Online Reload Server Throttling to set thresholds that can prevent reloads from impacting online processing. If MARS detects that any of the suspend thresholds are passed, reloads will be suspended and no more will be started using the indicated resource until the Resume Threshold has been passed.
Please note that these thresholds apply only to a single resource. If CPU 0 is more than 80 percent busy, MARS will not use that CPU for reloads, but may still start reloads on CPU 1. In this example, MARS will suspend reloading when CPUs exceed 80% busy and when the Queue busy percentage on the reloading file’s disk has exceeded 10%. A CPU or disk will be available for reloads when the percent busy is less than 60 and 5 percent.
Reloads on TMF protected files may be throttled based on several factors, including TMF transaction rate, audit dump disk space, and the number of scratch tapes available to save audit trails.
Audit trail capacity is extremely important, as the NonStop database cannot function if the oldest audit trail is pinned and the latest audit trail is full. MARS monitors this in two ways based on the active audit trail capacity used: it estimates the time at which the audit trail will be completely consumed, or reloads can be suspended based upon the current percentage of the audit trail that is currently consumed. In this example, the current audit trail is at 76 % capacity, so if we turn on monitoring of audit trail consumption, you can see that MARS reloads are throttled to prevent additional load on the audit trail. -
Merlon MARS Finding and Reloading Files
Reloads can be resource intensive, especially with large files, and just reloading with a low rate may reduce system impacts, but may also require excessive completion times. MARS deals with this in two ways: specifying only the files that need to be reloaded and performing those reloads in a controlled fashion.
Learn more about MARS
https://www.xypro.com/merlon/
Reloads can be resource intensive, especially with large files, and just reloading with a low rate may reduce system impacts, but may also require excessive completion times. MARS deals with this in two ways: specifying only the files that need to be reloaded and performing those reloads in a controlled fashion.
Rather than reading all the data in a file, MARS takes a sample to minimize the overhead of determining which files need to be reloaded. Select the Evaluate Files Report from the Tools menu to evaluate the reload state of your database in real time.
Select Criteria, then Set to choose the files to evaluate. Both Guardian and SQL/MX patterns may be chosen, as well as other criteria to identify the files to be scanned. Under the Reload Triggers tab, select the thresholds for the file attributes for which you would consider a reload would be required for the files in question, then press OK to display the list of files.
Note that reloads are performed at a partition level, so you will see the evaluation results by Guardian location, although you can choose to display the SQL/MX object name, if desired. Note that the “Will Trigger Reload” column indicates that two of the selected files would be reloaded according to the reload triggers we entered.
Once you are happy with the list displayed, select Criteria, Create Fileset from Criteria from Fileset to create a fileset using this report as a starting point. Give the fileset a name, then choose how and when the files will be scanned, as well as a reload schedule under which the resulting reloads will be performed.
Then, press the home button, then Manage Reload Fileset Scans. Beside the new fileset, you will see that it is scheduled to scan for the first time tonight, but we can manually start the scan via the Actions menu. We can then open the Manage Reload Queue to see the queued reloads in a waiting state.
Those reload will not be performed, however, until the DEFAULT reload schedule opens. The Manage Online Reload Servers page shows the next time that reload schedule will be open, at 1:00 am tomorrow morning. If we look at the properties for that reload schedule, we can see that it is open on weekdays from 1 to 7 am and will run up to three reloads at the same time on CPUs 0 and 1. -
Merlon SQLXPress Executing SQL Statements
For expert users, who are intimately familiar with SQL syntax, client interfaces can be cumbersome, so SQLXPress provides a “whiteboard” from which SQL statements can be executed directly.
Learn more about SQLXPress
https://www.xypro.com/merlon/
For expert users, who are intimately familiar with SQL syntax, client interfaces can be cumbersome, so SQLXPress provides a “whiteboard” from which SQL statements can be executed directly. This may be started from the Tools menu or by clicking Execute an SQL Statement on the SQL/MX or SQL/MP main menus.
You can enter one or more SQL statements in the SQL statements panel, with each statement terminated with a semicolon. Auto completion makes it easy to specify columns without syntax errors. Select Execute Line to execute the line on which the cursor resides, or Execute to execute all the statements in the panel.
When statements are executed, the results appear in the three tabs below the statement panel. The Messages tab lists error and status information about the query, the Query Results tab lists a grid view of SELECT statement results, and the Statistics tab lists the SQL statistics for executed queries. The results and statistics tabs may be copied and exported from the toolbar options.
Some of the useful features on this page include the SQL select, insert, update and delete templates, which display the appropriate statement for the indicated schema and table name. These statements can then be modified as desired.
On the left hand side, a history of your entered statements appears that can be moved into the statements panel to be executed again or altered to create new statements.
Beside the history tab, you can create snippets of SQL structures that you use often that may then be added to the statement panel to help build your statements. To create a snippet, enter the desired text in the statements panel, then press Add snippet.